
Introduction to Descriptive Statistics
Descriptive statistics is a branch of statistics that deals with summarizing and describing the basic features of a dataset. It involves the use of various techniques to present and summarize data in a clear and understandable manner. Descriptive statistics provides an overview of the dataset, including the distribution of values, central tendency, and variability. In this article, we will explore the different aspects of descriptive statistics, including measures of central tendency, measures of variability, data visualization, and more.
Measures of Central Tendency
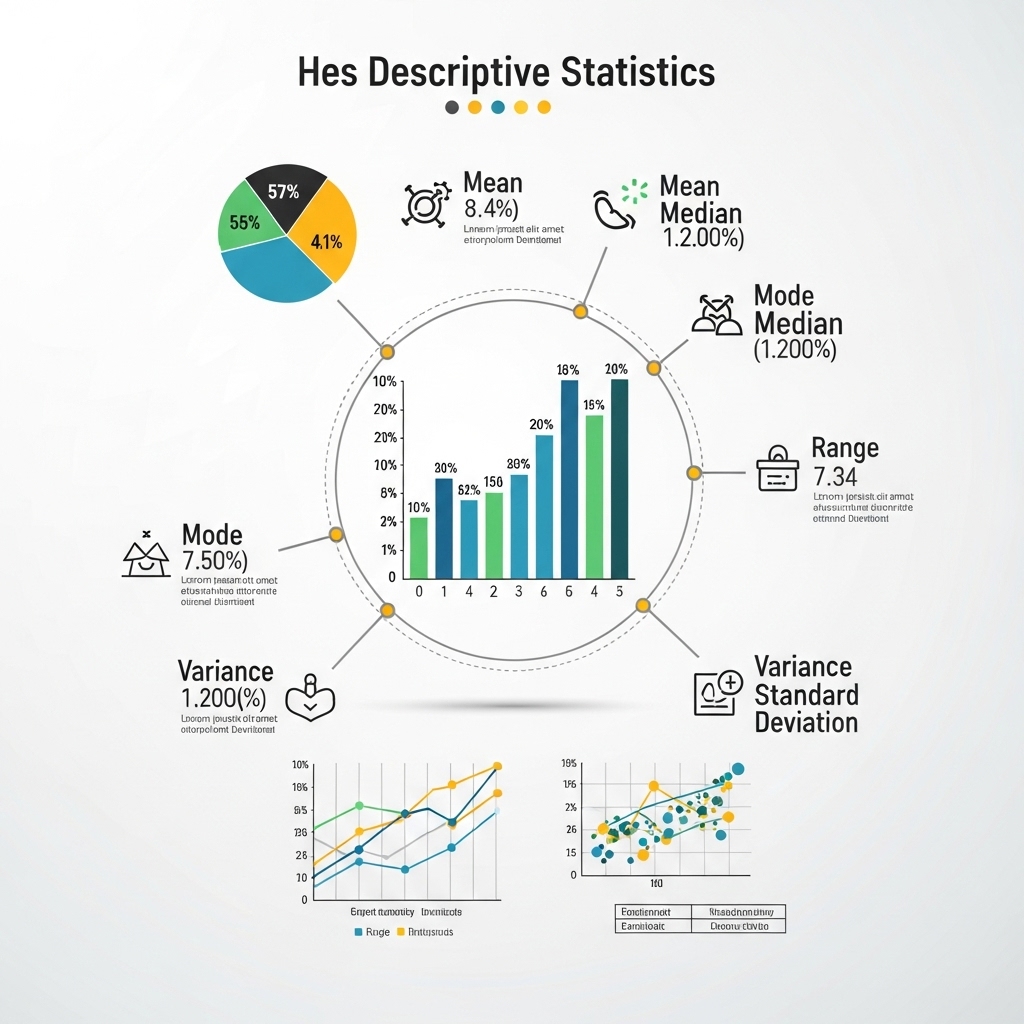
Measures of central tendency are used to describe the middle or typical value of a dataset. The three most common measures of central tendency are the mean, median, and mode. The mean is the average value of the dataset, calculated by summing up all the values and dividing by the number of values. The median is the middle value of the dataset when it is arranged in order. The mode is the most frequently occurring value in the dataset. For example, let's consider a dataset of exam scores: 80, 70, 90, 85, 95. The mean score is 84, the median score is 85, and the mode is 80.
Measures of Variability
Measures of variability are used to describe the spread or dispersion of a dataset. The most common measures of variability are the range, variance, and standard deviation. The range is the difference between the largest and smallest values in the dataset. The variance is the average of the squared differences from the mean. The standard deviation is the square root of the variance. For example, let's consider a dataset of stock prices: 100, 120, 110, 130, 105. The range is 30, the variance is 100, and the standard deviation is 10.
Data Visualization
Data visualization is an important aspect of descriptive statistics. It involves the use of graphs and charts to present data in a clear and understandable manner. Common data visualization tools include histograms, box plots, and scatter plots. Histograms are used to show the distribution of values in a dataset. Box plots are used to show the median, quartiles, and outliers of a dataset. Scatter plots are used to show the relationship between two variables. For example, let's consider a dataset of temperature readings: 20, 25, 30, 35, 40. A histogram of the data would show the distribution of temperatures, while a scatter plot of temperature vs. time would show the relationship between the two variables.
Percentiles and Quartiles
Percentiles and quartiles are used to describe the distribution of values in a dataset. Percentiles are used to divide the dataset into 100 equal parts, while quartiles are used to divide the dataset into 4 equal parts. The 25th percentile is also known as the first quartile (Q1), the 50th percentile is also known as the second quartile (Q2) or median, and the 75th percentile is also known as the third quartile (Q3). For example, let's consider a dataset of exam scores: 80, 70, 90, 85, 95. The first quartile (Q1) is 80, the median (Q2) is 85, and the third quartile (Q3) is 90.
Skewness and Kurtosis
Skewness and kurtosis are used to describe the shape of a dataset. Skewness measures the asymmetry of the dataset, while kurtosis measures the tail heaviness of the dataset. A dataset with positive skewness is asymmetric to the right, while a dataset with negative skewness is asymmetric to the left. A dataset with high kurtosis has heavy tails, while a dataset with low kurtosis has light tails. For example, let's consider a dataset of income levels: 10000, 20000, 50000, 100000, 500000. The dataset is skewed to the right, with a few very high income levels.
Conclusion
In conclusion, descriptive statistics is an important branch of statistics that deals with summarizing and describing the basic features of a dataset. It involves the use of various techniques, including measures of central tendency, measures of variability, data visualization, percentiles, quartiles, skewness, and kurtosis. By using these techniques, we can gain a better understanding of the dataset and make informed decisions. Whether you are a student, researcher, or business professional, descriptive statistics is an essential tool for analyzing and interpreting data.