
Introduction to Effective Data Visualization Tools
Data visualization is a crucial aspect of business intelligence, as it enables organizations to gain insights from complex data and make informed decisions. Effective data visualization tools are essential for businesses to communicate information clearly and efficiently. These tools help to transform raw data into interactive and dynamic visualizations, facilitating the identification of trends, patterns, and correlations. In this article, we will explore the key characteristics of effective data visualization tools for business intelligence and discuss their importance in today's data-driven world.
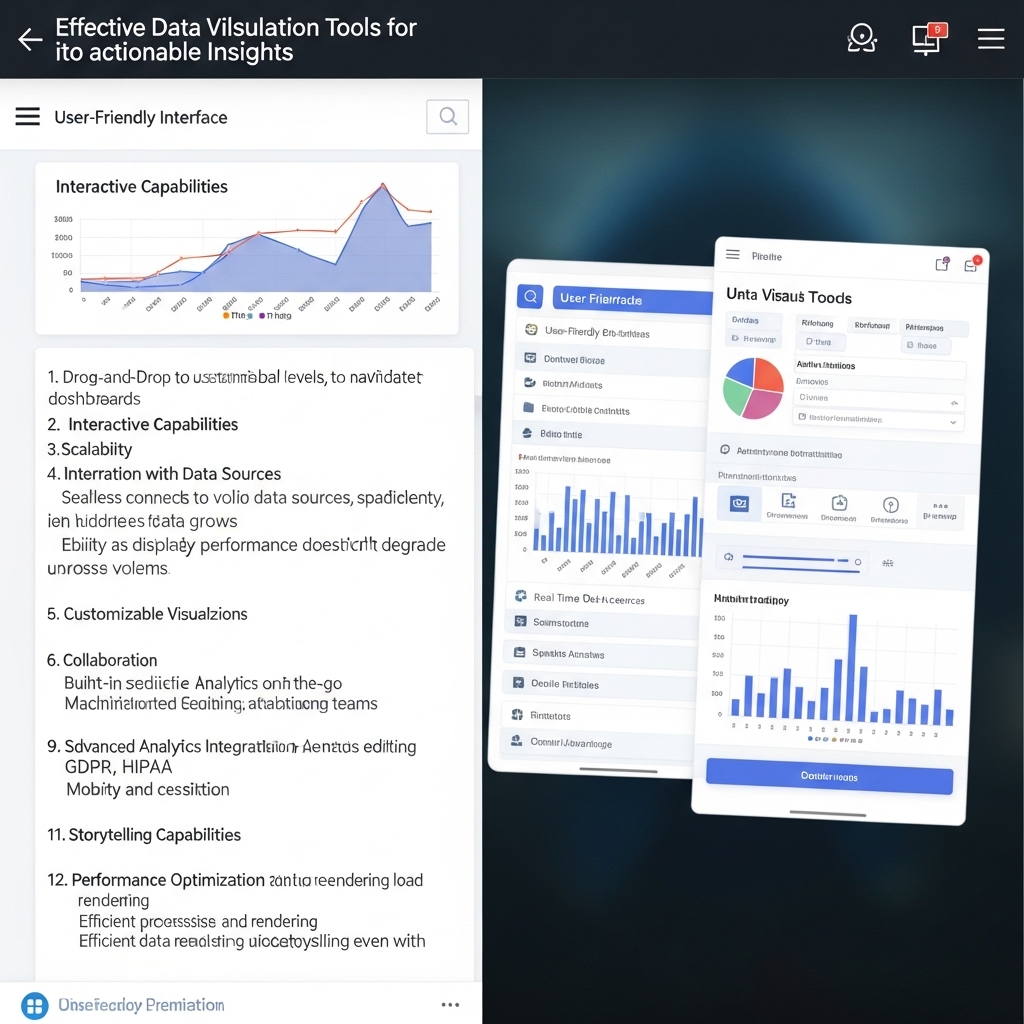
Key Characteristics of Effective Data Visualization Tools
Effective data visualization tools should possess certain characteristics that enable them to effectively communicate insights and support business decision-making. Some of the key characteristics include ease of use, flexibility, scalability, and the ability to handle large datasets. Additionally, these tools should provide a range of visualization options, such as charts, tables, maps, and heatmaps, to cater to different types of data and user preferences. For instance, Tableau and Power BI are popular data visualization tools that offer a user-friendly interface and a wide range of visualization options, making them ideal for business users.
Data Visualization Best Practices
When it comes to data visualization, there are several best practices that organizations should follow to ensure effective communication of insights. One of the most important best practices is to keep visualizations simple and intuitive, avoiding clutter and unnecessary complexity. This can be achieved by using clear and concise labels, avoiding 3D charts, and using color effectively. Another best practice is to use interactive visualizations that allow users to drill down into details and explore data from different perspectives. For example, a company like Google uses interactive visualizations to display search trends and patterns, enabling users to gain insights into user behavior.
The Importance of Real-Time Data Visualization
Real-time data visualization is critical for businesses that need to respond quickly to changing market conditions or customer behavior. Real-time visualizations enable organizations to monitor key performance indicators (KPIs) and respond promptly to anomalies or trends. This can be particularly useful in industries such as finance, healthcare, and e-commerce, where timely decision-making is crucial. For instance, a financial institution can use real-time data visualization to monitor stock prices and trading volumes, enabling them to make informed investment decisions. Tools like Apache Kafka and Apache Storm are designed to handle real-time data streams and provide instant insights.
Big Data Visualization Challenges and Opportunities
The increasing volume, variety, and velocity of big data pose significant challenges for data visualization tools. One of the major challenges is to handle large datasets and provide fast query performance. Another challenge is to provide meaningful insights from unstructured data, such as text, images, and videos. However, big data also presents opportunities for organizations to gain deeper insights into customer behavior, preferences, and needs. For example, a company like Amazon uses big data visualization to analyze customer purchase history and recommend products, improving the overall customer experience. Tools like Hadoop and Spark are designed to handle big data and provide scalable visualization solutions.
Future of Data Visualization Tools
The future of data visualization tools is exciting, with emerging technologies like artificial intelligence (AI), machine learning (ML), and augmented reality (AR) set to revolutionize the field. AI-powered visualization tools can automatically generate insights and recommendations, while ML algorithms can help to identify patterns and anomalies. AR and virtual reality (VR) can provide immersive visualization experiences, enabling users to interact with data in new and innovative ways. For instance, a company like Microsoft is using AR to provide interactive visualizations of complex data, such as 3D models and simulations.
Conclusion
In conclusion, effective data visualization tools are essential for business intelligence, enabling organizations to gain insights from complex data and make informed decisions. Key characteristics of effective data visualization tools include ease of use, flexibility, and scalability, as well as the ability to handle large datasets and provide real-time insights. By following best practices, such as keeping visualizations simple and intuitive, and using interactive and real-time visualizations, organizations can unlock the full potential of their data. As data continues to grow in volume, variety, and velocity, the importance of effective data visualization tools will only continue to increase, driving business success and innovation in the years to come.